
Behind the Grades

Krish Ghai had 101 rows of data in front of him, and every row was a person.
Not a statistic. A student who had filled out a survey about depression, anxiety, and panic attacks, alongside details like their CGPA, their major and their year of study. Most research papers on student mental health arrive from universities with research budgets and ethics boards. This one came from a student who decided to open Google Colab and find out what the numbers in his own campus community were actually saying.
The results, published on the Futurowise Ideas blog as part of our ongoing Student Projects series, are the kind of findings that make a counselor sit up straighter, and a small masterclass in what real data science looks like when applied to a subject most spreadsheets never touch.
One in three, not the exception
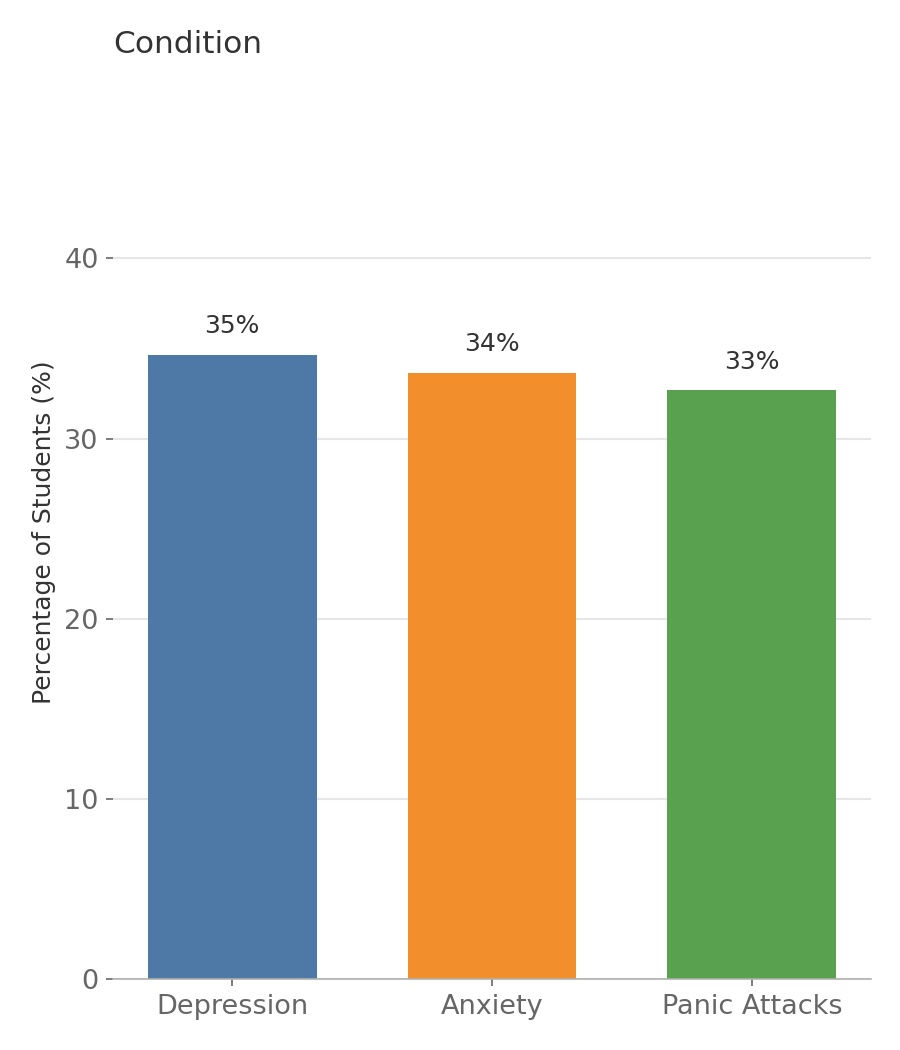
The first thing Krish wanted to know was simple. How common are these conditions, really. The answer was not comforting. Of the 101 students surveyed, 35 percent reported suffering from depression, 34 percent reported anxiety, and 33 percent reported panic attacks. These are not fringe numbers. Roughly a third of the entire sample was carrying at least one of these conditions.
Dig a layer deeper and the picture gets more specific. Eighteen students reported struggling with two conditions at once. Ten reported all three. That is 28 students, more than a quarter of the entire group, managing overlapping mental health challenges rather than a single isolated one. A student dealing with panic attacks and anxiety together is not facing double the difficulty of a student dealing with one. The load compounds.
Does the year of college matter
Krish then split the data by year of study, and Year 1 students stood out immediately. More than half of first year respondents reported struggling with at least one condition, the highest of any group. Year 4 looked completely different, with most students reporting no issues at all. It is tempting to conclude that students simply get better at managing the pressure over time, and that may well be part of the story. But Krish flagged an important caveat himself. Only eight students in the survey were in their fourth year, which means that single result could easily shift with a larger sample. Good data science means being honest about what your numbers can and cannot tell you, and this is exactly that kind of honesty.
Course of study told a sharper story than grades did
Here the findings get genuinely interesting for a counselor thinking about where to focus support. When Krish broke the data down by college course, BIT students reported the highest rate of struggle at 90 percent, followed by KOE at 83 percent, compared to a range of 57 to 61 percent for BCS, Engineering, and other courses. Both were small groups, ten and six students, so Krish treated this as a lead worth investigating further, not a settled conclusion.
What did not show a clear pattern was CGPA. The two largest CGPA bands in the dataset, 3.00 to 3.49 and 3.50 to 4.00, both sat close to a 65 percent struggle rate. A high grade point average, in other words, was no guarantee of wellbeing. Some of the most academically successful students in the sample were also among the most burdened.
The gap that matters most
The most striking number in the entire study has nothing to do with which students struggle. It is about what happens next. Among the 64 students in the survey who reported at least one condition, only 9 percent had sought professional help. Ninety one percent of students who were struggling never spoke to anyone qualified to help them.
Krish's own conclusion, and it is hard to argue with, is that this gap points either to persistent stigma around mental health conversations, or to a genuine shortage of accessible support systems on campus, or more likely, some combination of both. He is also careful to flag the limits of his own dataset, since the responses were self reported rather than clinically diagnosed, and a correlational study can point toward a pattern without proving what caused it. That honesty about limitations is itself a data science skill worth noticing.
How Futurowise can help
Projects like Krish's are exactly why Futurowise built its Data Science programme around real questions rather than abstract exercises. Turning a raw spreadsheet of 101 anonymous survey responses into a clear, honest, visual argument about a subject as sensitive as mental health takes more than knowing how to write code. It takes the judgment to flag a small sample size instead of overselling a trend, and the discipline to separate correlation from causation.
The other half of Krish's achievement is just as important. A finding is only useful if someone can explain it clearly to the people who can act on it, whether that is a college administrator, a peer support group, or a room full of fellow students. That is precisely what our Public Speaking programme is built to develop, the ability to take a complex, emotionally charged finding and present it with clarity and confidence.
The students who learn to ask good questions of data today, and who can then stand up and explain what they found, will be the ones shaping how institutions respond to problems like this tomorrow.
Explore our programmes: www.futurowise.com/courses


